Engineering teams today aren’t suffering from a lack of data. If anything, they have too much, and not enough time or clarity to make sense of it. Across ecosystems, platforms, and survey results, one thing is clear: signal overload is now one of the top challenges in incident response.
The Modern Observability Landscape
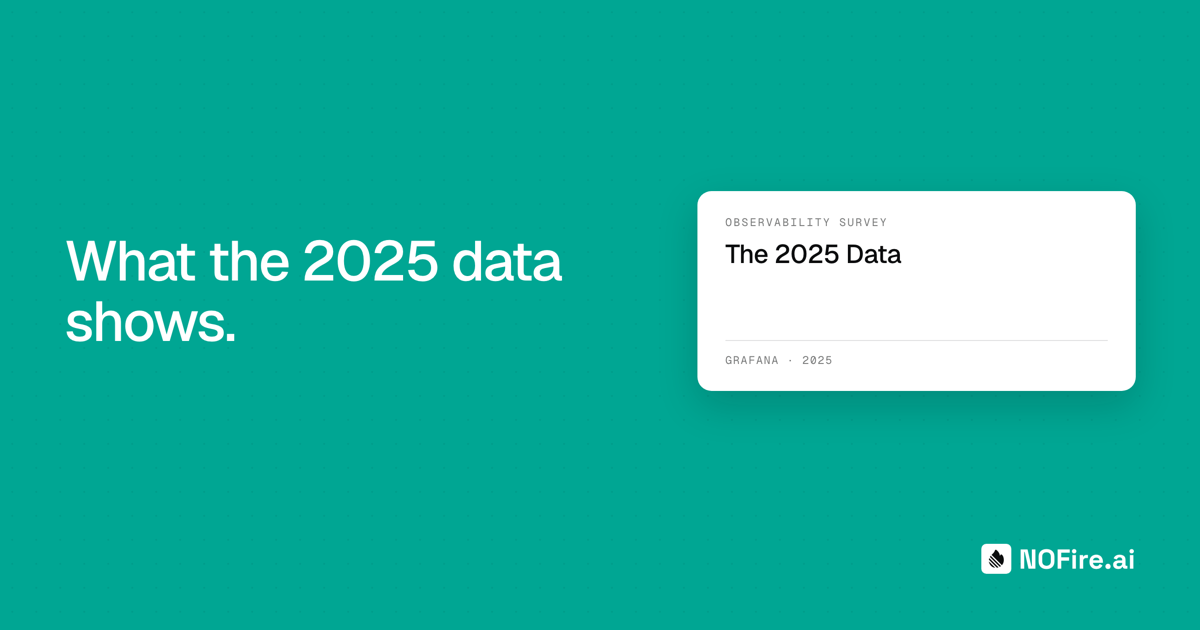
The 2025 Grafana Observability Survey reinforces what many engineering teams already feel every day: observability is essential, but increasingly difficult to manage at scale. With more than 100 different tools cited and an average of 8 observability technologies per team, engineers are navigating a sea of disconnected data.
Notably, Prometheus continues to dominate the landscape, used in production by 67% of companies. But it's OpenTelemetry that’s seeing a sharp rise: 79% of teams are already experimenting with or adopting it in production. This signals a shift toward open standards for instrumenting traces, metrics, and logs across distributed systems.
And yet, more tooling doesn’t always translate to better insights. As teams bring in more data sources (with many reporting 16+ sources in Grafana alone), context gets lost. It’s no surprise that 39% cite complexity and overhead as their biggest observability obstacle.
This context fragmentation increases the cost, not just in dollars, but in cognitive load and resolution time.
The 2025 Grafana Observability Survey reinforces what many engineering teams are already feeling: we’ve reached a tipping point. The average organization now uses eight different observability tools, and nearly 40% cite complexity and overhead as their biggest obstacles.
Telemetry is abundant, but insights remain scarce. Engineers are context-switching between dashboards, pipelines, logs, and metrics, all while under pressure to restore service quickly. It’s not just about collecting more data; it’s about extracting meaning from it faster.
Teams are juggling telemetry from OpenTelemetry, Prometheus, cloud APMs, and logs across multiple clusters and environments. Dashboards keep multiplying. Alerts keep firing. But when incidents happen, identifying what actually matters is still too slow.
This friction isn’t due to a tooling gap. It’s due to a context gap.
The Trend: Auto-Instrumentation and eBPF
One encouraging trend in the report is the rise of auto-instrumentation and eBPF as practical tools to reduce observability toil. Technologies like Grafana Beyla and Odigos make it easier to trace service behavior and capture telemetry without invasive code changes.
These tools help bridge gaps across dynamic Kubernetes environments, improving visibility across services that change frequently. But again, they are only part of the solution: visibility is only as good as what you can interpret from it in real time.
More teams are adopting technologies like eBPF and auto-instrumentation to reduce manual toil and increase visibility, especially in Kubernetes and microservices. Tools like Beyla and Odigos offer valuable pathways to instrument complex environments without adding friction.
These innovations make it easier to collect more telemetry, faster. But collection is only one part of the equation.
The Gap: Too Many Signals, Not Enough Insight
Despite the growth of OpenTelemetry, auto-instrumentation, and distributed tracing, most organizations still struggle with signal-to-noise. Teams are overwhelmed by redundant alerts and siloed views, especially those managing 20+ data sources or more than 5,000 employees.
This complexity makes it difficult to answer simple but critical questions during an incident: What changed? Who changed it? What did it break?
Compounding the challenge is cost. While only a third cite high price as their top concern, hidden costs (like delayed MTTR, escalations, or unplanned downtime) are often larger. Over-collecting telemetry can drive up bills, especially with ingestion-based pricing models, without adding operational clarity.
In practice, engineers still struggle to:
- Correlate across tools
- Connect changes to symptoms
- Understand what changed, when, and why
During incidents, the telemetry is there. But making it actionable, especially under pressure, is where things break down.
NOFire AI’s Take: Observability Needs Causality
As companies embrace OpenTelemetry, adopt more tools, and increase their trace volumes, it’s not enough to simply collect more data. Teams need to connect the dots between telemetry and action.
That’s where NOFire AI fits in:
- Causal Graphs: We don’t just show logs or metrics. We map service behavior and changes across deployments, GitHub events, and runtime traces to reveal the root cause.
- Agentic AI: Our AI agents simulate how real engineers triage, escalate, and resolve issues. They prioritize events by business impact and system risk.
- Change Context: NOFire pulls in GitHub PRs, release tags, Argo CD deployments, and prior incidents to surface the most relevant context at a glance.
This turns your data from a pile of alerts into a clear, action-ready incident timeline.
In a world where 33% of orgs see MTTR as the #1 reason for adopting SLOs, and where fast RCA is an AI wishlist item for large teams, our approach bridges the gap between signal and resolution.
While observability platforms have matured, the Grafana survey makes one thing clear: teams are still spending too much time piecing together what changed and why it matters.
At NOFire AI, we tackle this gap head-on. We integrate signals across tools (OpenTelemetry traces, GitHub PRs, CI/CD events like GitHub Actions and Argo CD, prior alerts and incidents) and stitch them into a single, intelligent view.
We ingest metrics, logs, traces, and config changes, and map them into a system-wide cause-effect model. That way, when something breaks, your team doesn’t just see red; they see root cause, impact, and next best action.
Rethinking Your Observability Strategy
Engineering teams today aren’t lacking data, they’re overwhelmed by it. And yet, when incidents strike, even the most instrumented systems can leave teams scrambling for answers.
It’s worth taking a hard look at your current observability approach.
Are your engineers truly resolving incidents, or are they spending more time resolving confusion?
When outages happen, do you immediately know what changed, or are you forced to guess and piece things together?
Can your tooling connect telemetry to business impact, or does it just surface symptoms in yet another dashboard?
Is your current setup actually helping reduce mean time to resolution, or is it increasing cognitive overhead with endless context switching?
How many tools are you relying on, just to reconstruct a clear, accurate timeline of events?
More data isn’t the answer if it arrives fragmented, delayed, or stripped of meaning. The real challenge isn’t in collection, it’s in interpretation. What teams need most are context, causality, and correlation. These are the elements that shift observability from being a reactive burden to becoming an operational advantage.
If your observability stack can’t tell you what changed, why it matters, and what to do next, then it isn’t helping, it’s hiding the problem beneath layers of noise.
That leads to a deeper question: is your observability strategy enabling your team to move faster and think more clearly under pressure, or is it just collecting more data than anyone has time to use?
In 2025, the challenge isn’t about gathering more signals, it’s about understanding them. The teams that will lead are not those with the most dashboards, they’re the ones who can see through the noise first.
Why It Matters
The 2025 survey made one thing clear: observability has outgrown its infrastructure roots. It’s now a business-critical concern, with 75% of organizations saying it's a CTO or VP-level priority.
But as the volume of telemetry grows, teams are shifting focus. They’re less concerned with cost alone and more focused on value: reducing MTTR, improving accountability, and cutting alert fatigue.
The rise of SLOs reflects this shift. With 73% of teams investigating or using SLOs today, organizations are moving toward defining what matters to users, and focusing their observability strategy around it.
That’s why causal AI is key: it gives teams the ability to trace telemetry back to what actually caused the issue and what matters most to reliability targets.
More data alone won’t make incidents easier to solve. Smarter context, faster correlation, and guided response will.
As 2025 unfolds, the winning observability strategies won’t be about more dashboards. They’ll be about:
- Real-time context over reactive triage
- Cause-effect clarity over data dumps
- Empowered humans, backed by AI, not buried by it
If you're facing alert fatigue, noisy dashboards, or slow MTTR, we'd love to share how teams are cutting through the noise. Book a demo or check out our latest thinking on incident intelligence.