On SREGym-lite, under observe-only diagnosis, NOFire diagnosed 17 of 20 faults (85%). Eleven scored a perfect 1.00. Fifteen of those 17 wins came from the production map or a recorded change event. One win needed a named log line. One needed a frozen consumer-lag metric. Three faults stay outside what was observed.
This post is the protocol, the full table, and that boundary. We are not climbing a leaderboard. We use SREGym as an independent rubric we did not write.
Our first AI SRE Benchmark (April) measured causal accuracy on RCAEval across 735 scenarios. This run asks a different question: can a continuously recorded graph diagnose quiet Kubernetes faults without probing the live cluster?
Protocol
SREGym is an independent, MIT-licensed benchmark from Tianyin Xu's lab at UIUC, with collaborators at the University of Toronto, supported by a Slingshot grant from the Laude Institute and NSF. It deploys real Kubernetes apps (OpenTelemetry Demo, social network, hotel reservation) and injects faults with Kubernetes API changes, eBPF syscall probes, and operator misoperation. Every problem has a real defect. The paper describes 90 problems. The active registry is now about 122. We ran the maintainers' 20-problem lite suite as it stood at the time.
Rules we held:
- Oracle. SREGym's own LLM judge scores each diagnosis on three dimensions, each 0 to 1:
- Localization (L): did we name the component the fault lives in?
- Characterization (C): did we name the mechanism, not only the symptom?
- Scope (S): did we get the blast radius right, without over- or under-claiming?
The composite is the average of the three, shown as
L/C/S. Pass is composite ≥ 7/9 (about 0.78), the benchmark's threshold. Example:1/0.67/1is the right component and blast radius, with a partial mechanism. A miss can still earn partial credit. We do not count that as a pass.
- No kubectl during diagnosis. Most SREGym agents can
describethe injected fault. NOFire cannot. Diagnosis uses only the graph, change history, and telemetry already recorded. If a signal was never captured, the system does not get to go look. These scores are not comparable to a kubectl-enabled agent. - No pre-localization. One prompt template for every fault. It names the app and namespace. It never names the fault, the service, or the symptom. A production alert usually hands you localization. This protocol does not.
- One scored attempt per fault. No best-of-N. New graph checks this cycle were confirmed on a second independent run for the faults they unlocked.
- Invalid is not a score. Dead telemetry, a hung edge, leftover cluster-scoped artifacts, a crash confound, or an empty model report: discard, reset, re-run. Never re-roll for a better number.
This matches how the product runs: diagnose from context you already trust, then act only under explicit policy. See Runtime Policy Patterns for that split.
Results
17 of 20 diagnosed (85%), observe-only. Eleven perfect. Zero near misses. Three failures.
| Verdict | Count |
|---|---|
| Diagnosed (composite ≥ 0.78) | 17 (11 at 1.00) |
| Near miss | 0 |
| Failed | 3 |
Lite is the hard-but-observable slice. 85% is the ceiling on that slice, not on the whole registry.
Across the full ~122-fault registry we estimate ~70-75% for a real GitOps deployment. That is an estimate, not a measurement: 20 faults were run. The rest follow from whether the cause leaves a trace in the graph, a change event, git, metrics, or logs. Two forces move the number. Down: the registry's tail has more no-trace faults (hardware, metric-only) than lite does. Up: when change ships through GitOps, a misconfigured probe, a downgraded ClusterRole, or a scheduling constraint arrives as a committed diff. The same fault can be invisible if someone patches the live cluster.
Faults that need a live probe to catch a silent handshake error sit outside observe-only on purpose. In production those changes usually land as commits first.
Upstream has added a 21st lite problem (a metastable retry-collapse). We will fold it in next pass. We expect it to sit on the observe-only boundary.
What carried each diagnosis
Four channels appear in the table.
- Graph: a deterministic spec-health scan of recorded state (0 endpoints,
dnsPolicy=None, deny-all NetworkPolicy, a quota that rejects undeclared memory). - Change: a field-level diff with provenance: which key, on which entity, at what time.
- Logs: a named error in a log stream.
- Metrics: a consumer-lag series frozen against a still-advancing producer.
Cloud is wired in production. Lite front-loads spec and config faults, so cloud carried none of these 20.
| Fault (SREGym-lite ID) | Composite | L/C/S | Channel | What named the cause |
|---|---|---|---|---|
cronjob_sidecar_blocks_completion_hotel_reservation | 1.00 | 1/1/1 | Graph | Terminated main container, still-Running sidecar on a Job-like pod |
internal_traffic_policy_local_astronomy_shop | 1.00 | 1/1/1 | Graph | itp=Local with backing pods off the traffic nodes |
service_dns_resolution_failure_social_network | 1.00 | 1/1/1 | Change | Recorded CoreDNS NXDOMAIN config change |
wrong_dns_policy_astronomy_shop | 1.00 | 1/1/1 | Graph | Running pod with dnsPolicy=None |
wrong_service_selector_social_network | 1.00 | 1/1/1 | Graph | Service with 0 endpoints over a Ready pod |
mutating_webhook_resource_limits_social_network | 1.00 | 1/1/1 | Graph | Pod effective memory limit below its controller template |
service_wrong_pod_selection_hotel_reservation | 1.00 | 1/1/1 | Graph | Selector matches pods exposing none of targetPort |
network_policy_block | 1.00 | 1/1/1 | Graph | Deny-all NetworkPolicy, ingress and egress, no allow rules |
namespace_memory_limit | 1.00 | 1/1/1 | Graph | Memory-enforcing ResourceQuota vs workload declaring none |
admission_webhook_outage_hotel_reservation | 1.00 | 1/1/1 | Logs | Named admission denial in ReplicaSet logs; webhook object not in the graph |
kafka_poison_pill_hol_block | 1.00 | 1/1/1 | Metrics | Consumer lag frozen at offset 20 while the producer kept advancing; parse error on the poison record |
edge_request_filter_cpu_saturation | 0.89 | 1/0.67/1 | Change | WAF-rule change judged reactive, not causal |
env_variable_shadowing_astronomy_shop | 0.89 | 1/0.67/1 | Change | Shadowed duplicate env var in the recorded spec |
secret_rotation_stale_env_credentials_astronomy_shop | 0.89 | 1/1/0.67 | Change | Secret rotation; running pod still holds the old credential |
duplicate_pvc_mounts_social_network | 0.89 | 1/1/0.67 | Graph | RWO PVC with a Running holder and a distinct Pending waiter |
unschedulable_incorrect_port_assignment | 0.89 | 1/0.67/1 | Graph | Pending pod whose nodeSelector matches no node |
rolling_update_misconfigured_social_network | 0.78 | 1/0.33/1 | Graph | Localized from initContainerStatuses; strategy field unmodeled |
readiness_probe_misconfiguration_social_network | 0.34 | 0.33/0/0.67 | None | Bad probe path on a valid port; kubelet 404 event not captured |
valkey_auth_disruption | 0.11 | 0/0/0.33 | None | Client logs a generic "can't connect"; server never logs the rejection; auth change not in the graph |
finalizer_deadlock_controller_hotel_reservation | 0.00 | 0/0/0 | None | No user-facing symptom; finalizers/deletionTimestamp not captured; 403s uncorrelated |
L/C/S is localization, characterization, scope. The composite is their average, up to the oracle's rounding.
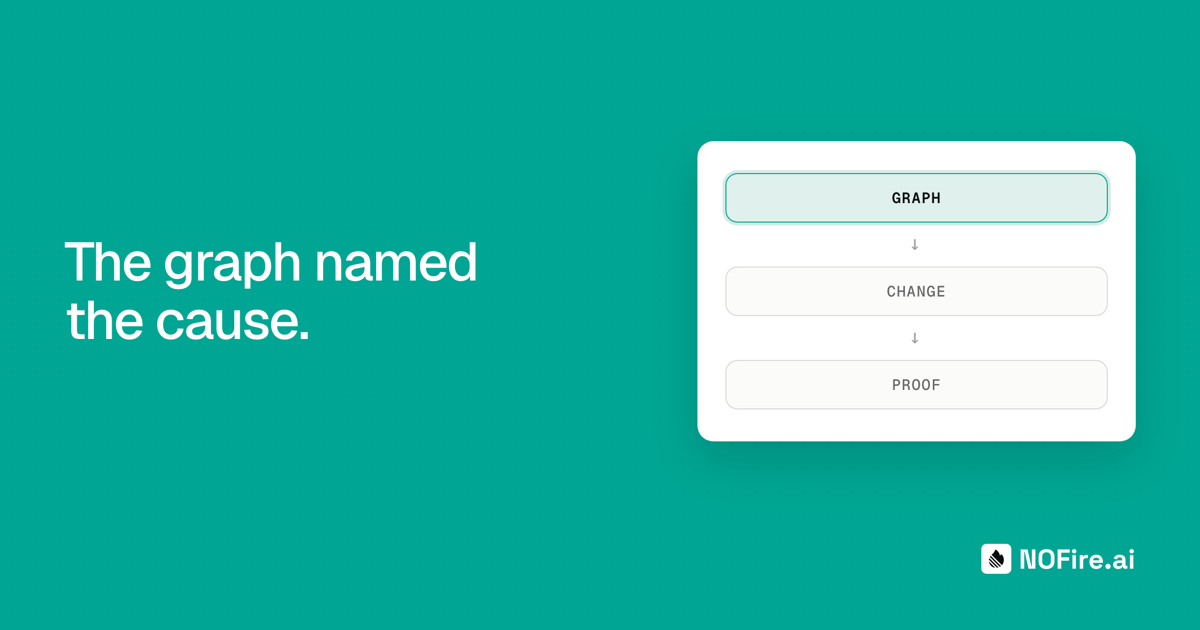
15 of 17 wins were graph (11) or change (4). That ratio holds on a spec/config-weighted suite. It does not prove the same split on every fault class.
A change event is not a Kubernetes Event. kubectl get events says "Deployment updated." The graph stores the field-level delta. After a Secret rotation, kubectl describe shows a valid pod. The observer already recorded that the running container still holds the old credential. That is the same requirement as a system of record for production: observed, continuously maintained, rewindable. Spec-health only works if the graph was already watching. The capture layer is also the hard part of a self-maintaining catalog: if the graph is not continuously observed, both diagnosis and inventory drift.
The graph is a typed model. Each entity is one of a fixed set of kinds. Each relationship is one of a small closed set of predicates. Each fact carries provenance and a confidence: observed in traffic, declared in code, inferred, or asserted by a human. That ontology is built in code, not sampled from a model. The agent narrates those cited facts. It does not assert a new fact from parametric memory.
Timing turns a guess into a testable hypothesis. A field that changed seconds before errors started is a candidate. A value stable for weeks is not. Timing is not proof of causation. The diagnosis still has to show the mechanism. A live probe cannot do this: by the time you look, the change is already the current spec.
Kafka poison-pill
kafka_poison_pill_hol_block pages no one. Probes stay green. Error rate stays flat. Nothing restarts. One consumer is stuck on an unprocessable record. Lag climbs while the producer keeps writing.
NOFire named it from that frozen lag and the parse error in the consumer log: partition halted at offset 20, lag growing 32 to 179, JSON parse error on the poison record.
Kafka is first-class in the graph: cluster, broker, topic, and the service that actually consumes. A stalled lag number has an owner. That is the same work as naming poison pills and silent lag. For a stall that leaves Kafka entirely, following it across a hop.
The three misses
Two are capture gaps. One is a wall.
- Readiness (0.34): bad probe path on a valid port. The kubelet's
Readiness probe failed: 404event is not captured yet. - Finalizer (0.00): no user-facing symptom.
deletionTimestampand finalizers are not in the graph. Controller 403s are not correlated to the stuck object. - Valkey auth (0.11): the client logs a generic "can't connect to redis." The server never logs the rejection. The auth change is not in the graph. No distinguishing signal exists to observe, including for a human who is not already reading the dependency's secret.
What we added, refused, and left open
We use SREGym to find gaps in what we observe, then decide: real production signal, or benchmark artifact? SREGym is in the evaluation framework, not only the 20-fault lite slice this post reports. The rest of the registry is in that loop too. A new check has to stay silent on a healthy cluster. A miss we refuse stays a miss until a real signal exists.
Added. A Pending pod pinned by a nodeSelector no node satisfies. A namespace ResourceQuota that will reject the next deploy. A mutating webhook rewriting a memory limit. Genuine misconfigurations. We were not capturing the field or the object. We added deterministic checks that stay silent on a healthy cluster.
Refused. A readiness probe on the wrong path, valid port. The tempting check is "flag any probe port missing from containerPorts." We built it and dropped it. containerPorts is informational in Kubernetes. That check pages healthy clusters. We would rather miss a benchmark instance than ship a detector that false-positives in production.
Open, in order. Kubernetes Events as first-class evidence (probe failures, FailedScheduling, admission denials). Then scheduling objects (taints, PV affinity, PriorityClass). Then finalizers. Response-only auth stays on the floor: there is no signal to record.
Independent RCA evaluations keep finding the same pattern. Full metrics, traces, and logs are necessary. They are not sufficient when the cause is a spec delta telemetry never names.
What this run did not measure
SREGym-lite ran on a local Kubernetes cluster. It exercised the Kubernetes slice of the graph.
In production the same graph is wider:
- Cloud (AWS, Azure, GCP). A security group, RDS parameter, or IAM change sits next to the pod it breaks.
- Git as source of truth. Each running service links to the repo and commit that produced it. A change event points at the entity, the field, the time, and the PR.
Those connections are production capabilities. SREGym did not score them.
SREGym also scores a mitigate phase. We report diagnosis only. Today NOFire assembles evidence and recommends the entity, the change, the fix, and the record others can open. Write access to a customer cluster stays with the people who own it.
We intend to close that loop only when we can prove the action stays contained, even under a poisoned dependency or a prompt injection. That bar is in the sandboxing whitepaper: microVM isolation, deny-by-default capabilities, reproducible images, hard resource limits, per-step checkpoint and rollback. Investigation already runs inside that boundary. Mitigation does not, yet. Until it does, the deliverable is a trustworthy diagnosis and a recommendation you can act on. For the broader control question (agents in production without losing the record), see the AI SRE Adoption Guide.
The same spec-health checks that win these faults (zero endpoints, deny-all NetworkPolicy, a quota that will reject the next deploy) also run as a continuous scorecard on live clusters. They stay silent where the cluster is healthy. They flag drift before it pages. Incident response is the last line. The graph is built to catch the misconfiguration while it is still a line on that scorecard.
Build vs buy
Wiring a frontier model to Prometheus is not an AI SRE system. Quiet faults need a graph that was already recording, checks that stay silent when nothing is wrong, and an eval harness that keeps the boundary honest.
The expensive part of an incident is shared context: what changed, on which entity, with the code and the record the team can open. A model asked after the fact cannot recover a signal that was never recorded.
The decision is whether you intend to own that graph and that eval loop. Run your system against SREGym before you decide. The Build vs Buy guide is the opportunity-cost frame against your core product. The AI SRE Buyers Guide is the checklist for any path, including one you build: quiet-fault localization, evidence without probing, an honest miss when the object was never recorded.
Where to start
To see the production map on your cluster: get a demo.
If the decision is build vs buy, start with the Build vs Buy guide and the AI SRE Buyers Guide. SREGym is the quiet-fault line. Those guides are how to spend engineering time against that line on purpose.
Run it yourself: SREGym on GitHub. SREGym-Lite needs 8 vCPU / 16 GB. Publish the protocol with the score. If you allow kubectl during diagnosis, say so. If you do not, say so. The paper is the independent rubric. Prior causal-accuracy results: AI SRE Benchmark on RCAEval.