I've spent years working with customers on Kafka reliability. The outcome that's always been missing isn't access to the topic. It's visibility end to end: from the application, through the topic, to every application depending on it.
A week ago we put Kafka into NOFire's production map. Clusters, topics, and the services that produce and consume them became entities alongside the microservices and deployments we already tracked. That part is done. This post is what that outcome actually looks like end to end: following a stall out of Kafka entirely, into a service that never touches a topic.
The number that can't tell you why
A consumer's lag climbing is the most cause-agnostic signal in the stack. A poison record it can't parse, a downstream dependency that stopped answering, a bad deploy, or the consumer simply doing more work than it can, all freeze the committed offset in exactly the same shape: the position stops moving while the log keeps advancing. The number alone can never tell these apart. Only what changed on the consuming service, and around it, can.
The pipeline
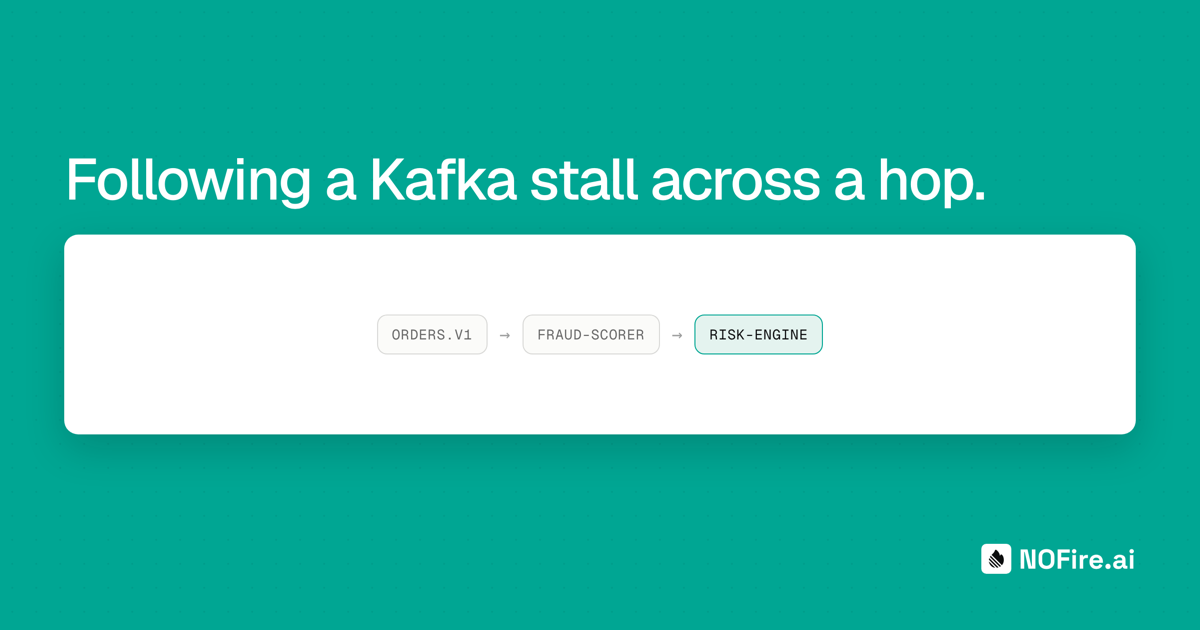
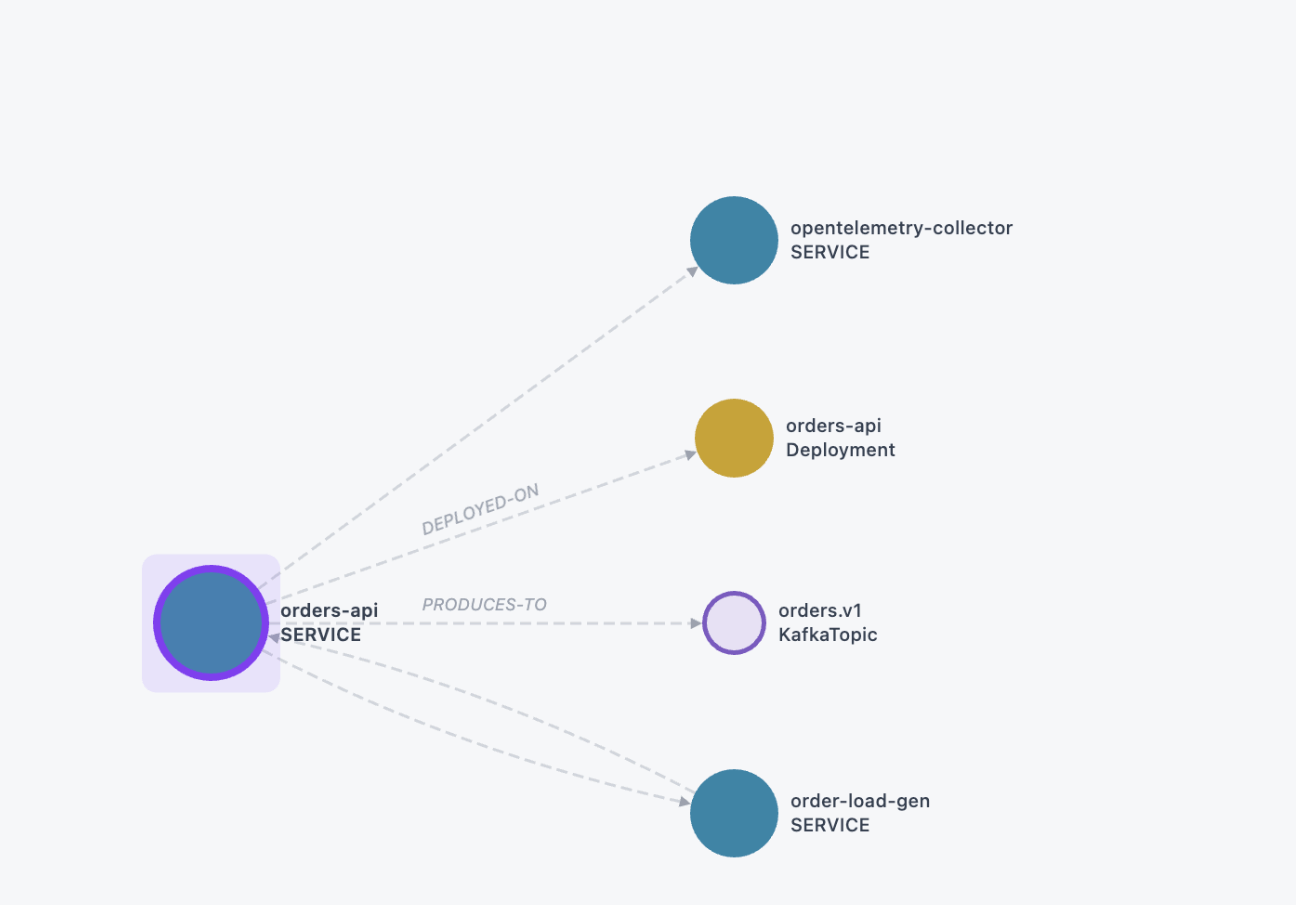
Here's the shape of it: an order comes in through orders-api, lands on the orders.v1 topic, gets picked up by fraud-scorer, which calls risk-engine over HTTP before handing off to ledger. Nothing in that chain is unusual, and nothing in it crashes.
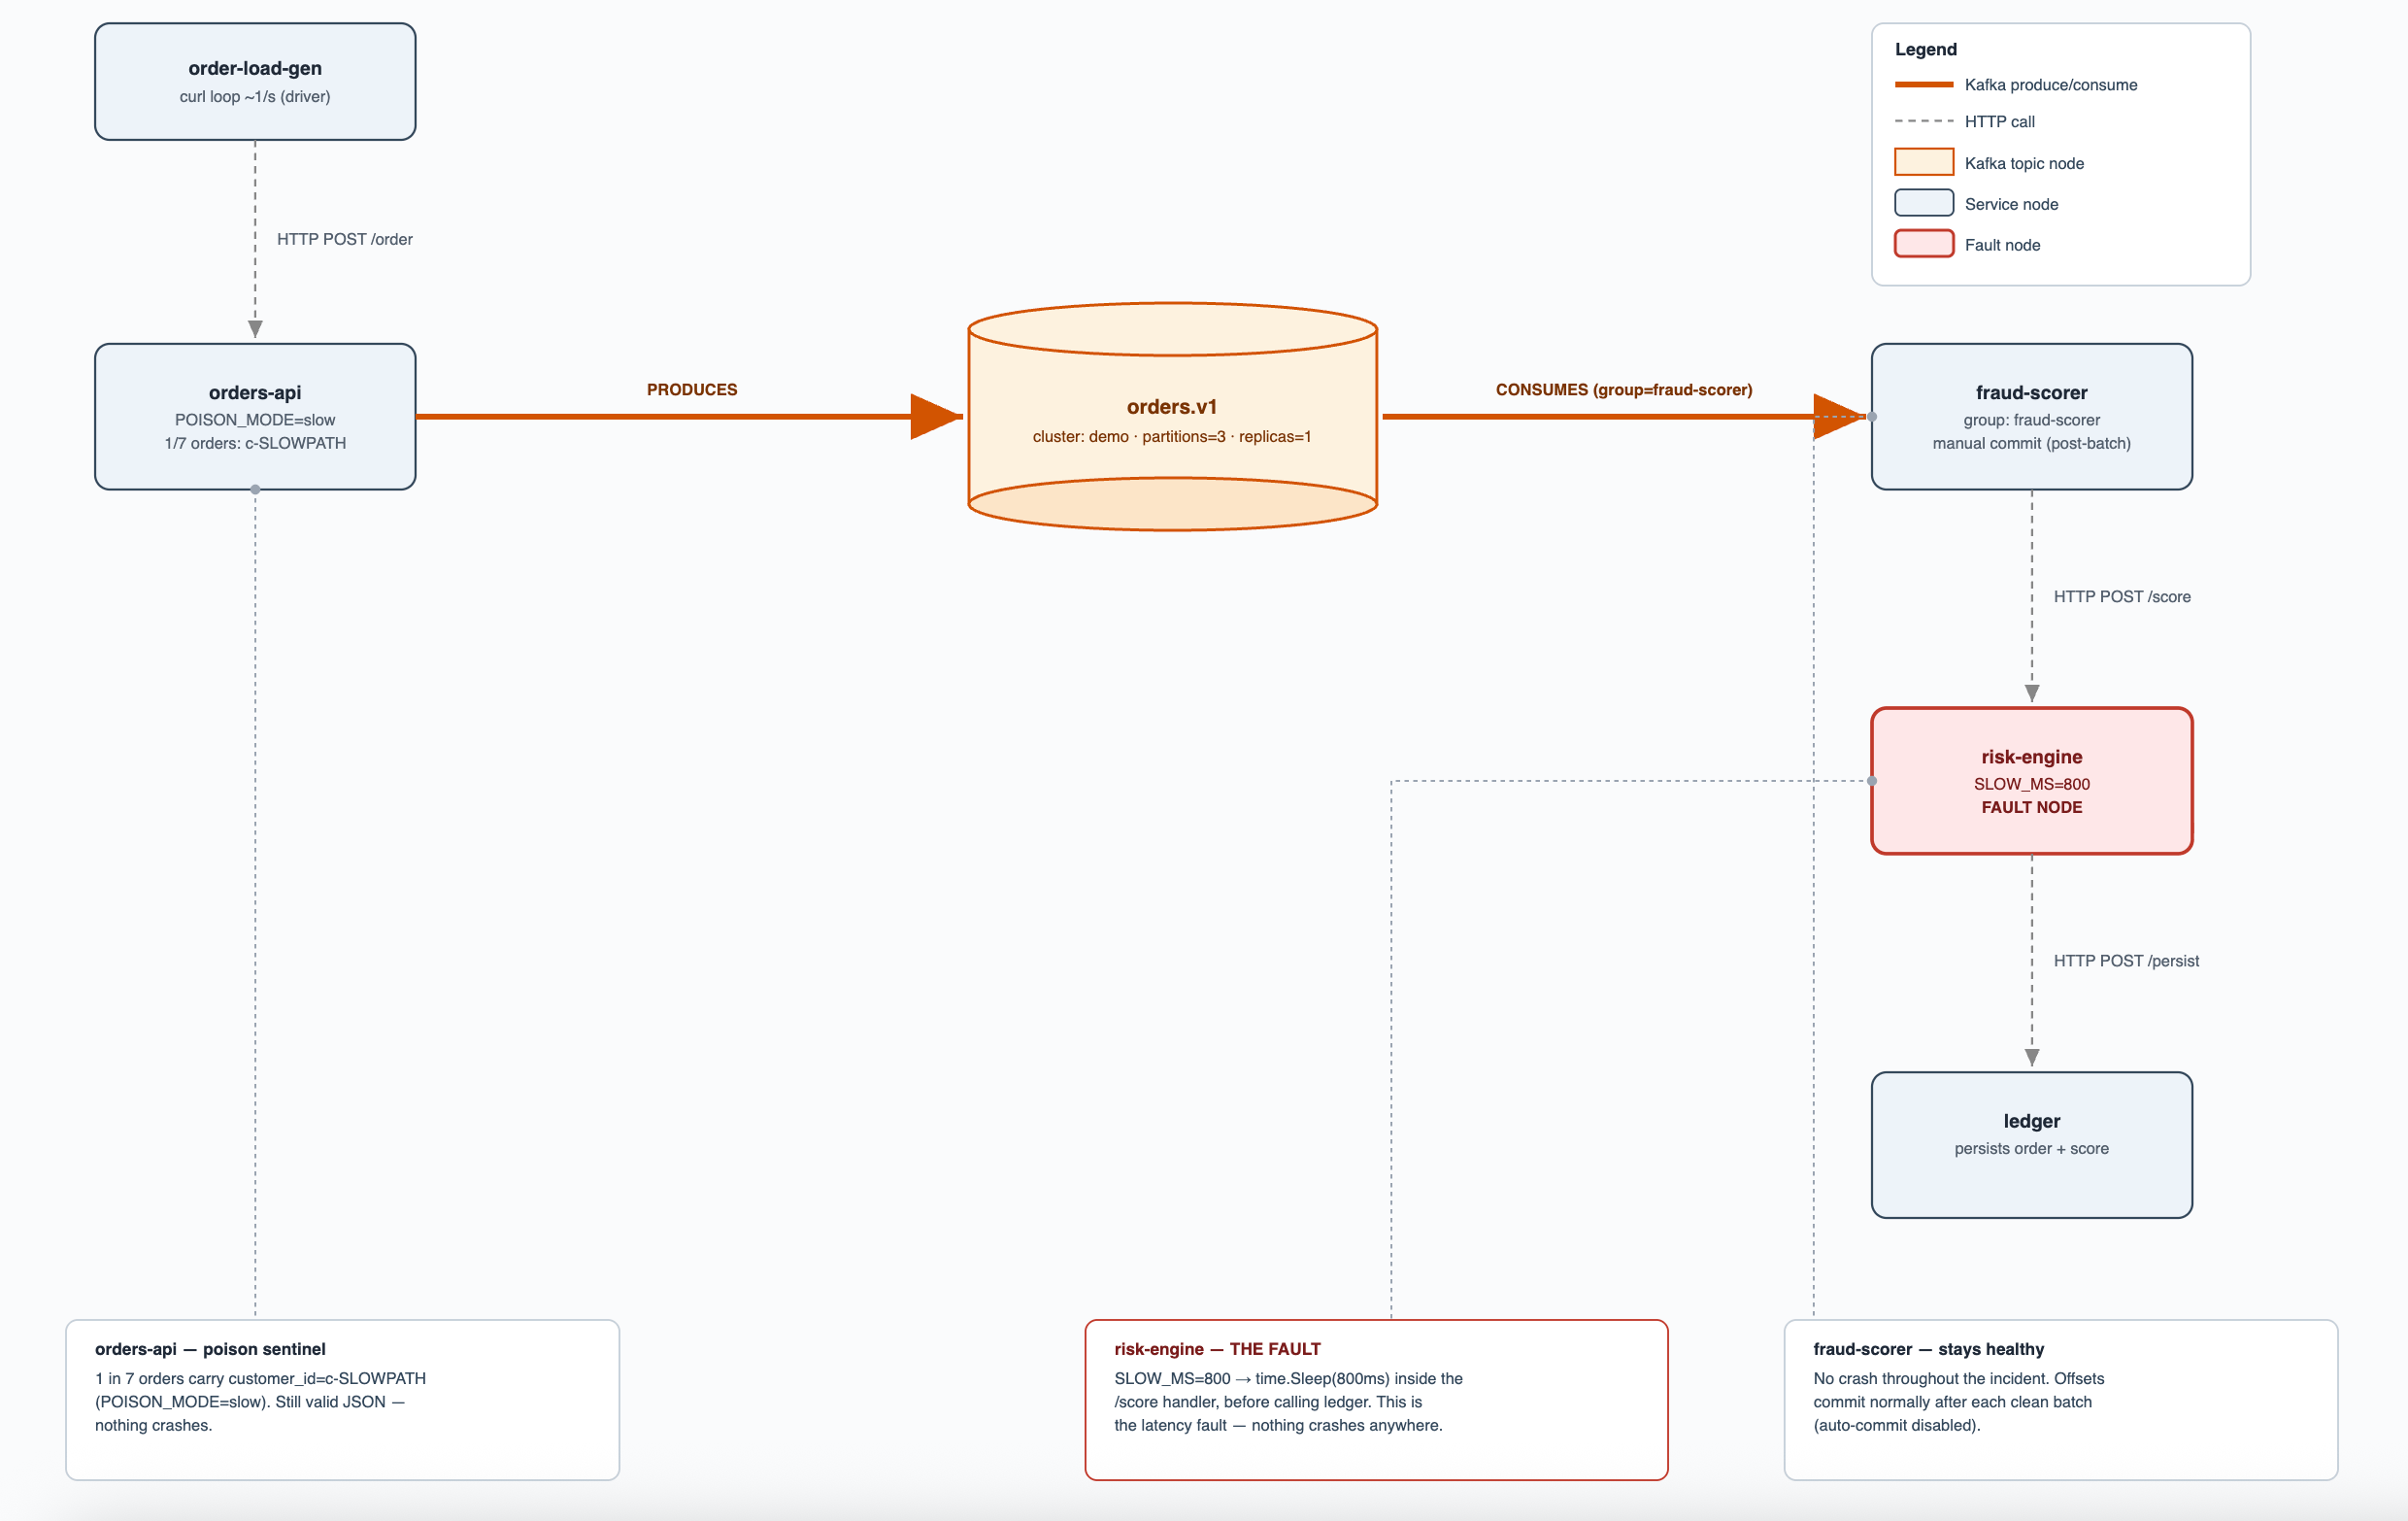
risk-engine sleeps 800ms on every call it receives. That's the whole fault: nothing crashes, no error is thrown anywhere in the chain.
fraud-scorer stays healthy the whole time. It commits normally, batch after batch. And its lag on orders.v1 climbs anyway, because risk-engine, two hops downstream and touching no Kafka at all, is slow to answer.
The walk
This is the case every lag chart misses, because the chart only ever looks at the topic and the consumer sitting on it. It never looks past the consumer.
NOFire's graph does, because it was never built to stop at the Kafka boundary. orders.v1 shows fraud-scorer as a consumer and orders-api as a producer. fraud-scorer shows a dependency edge to risk-engine. That's blast radius: not a Kafka-specific feature, the same dependency graph that already tells you which services sit downstream of a canary before you ship it. Kafka's topics and consuming services becoming first-class nodes is what lets a Kafka symptom reach that graph in the first place.
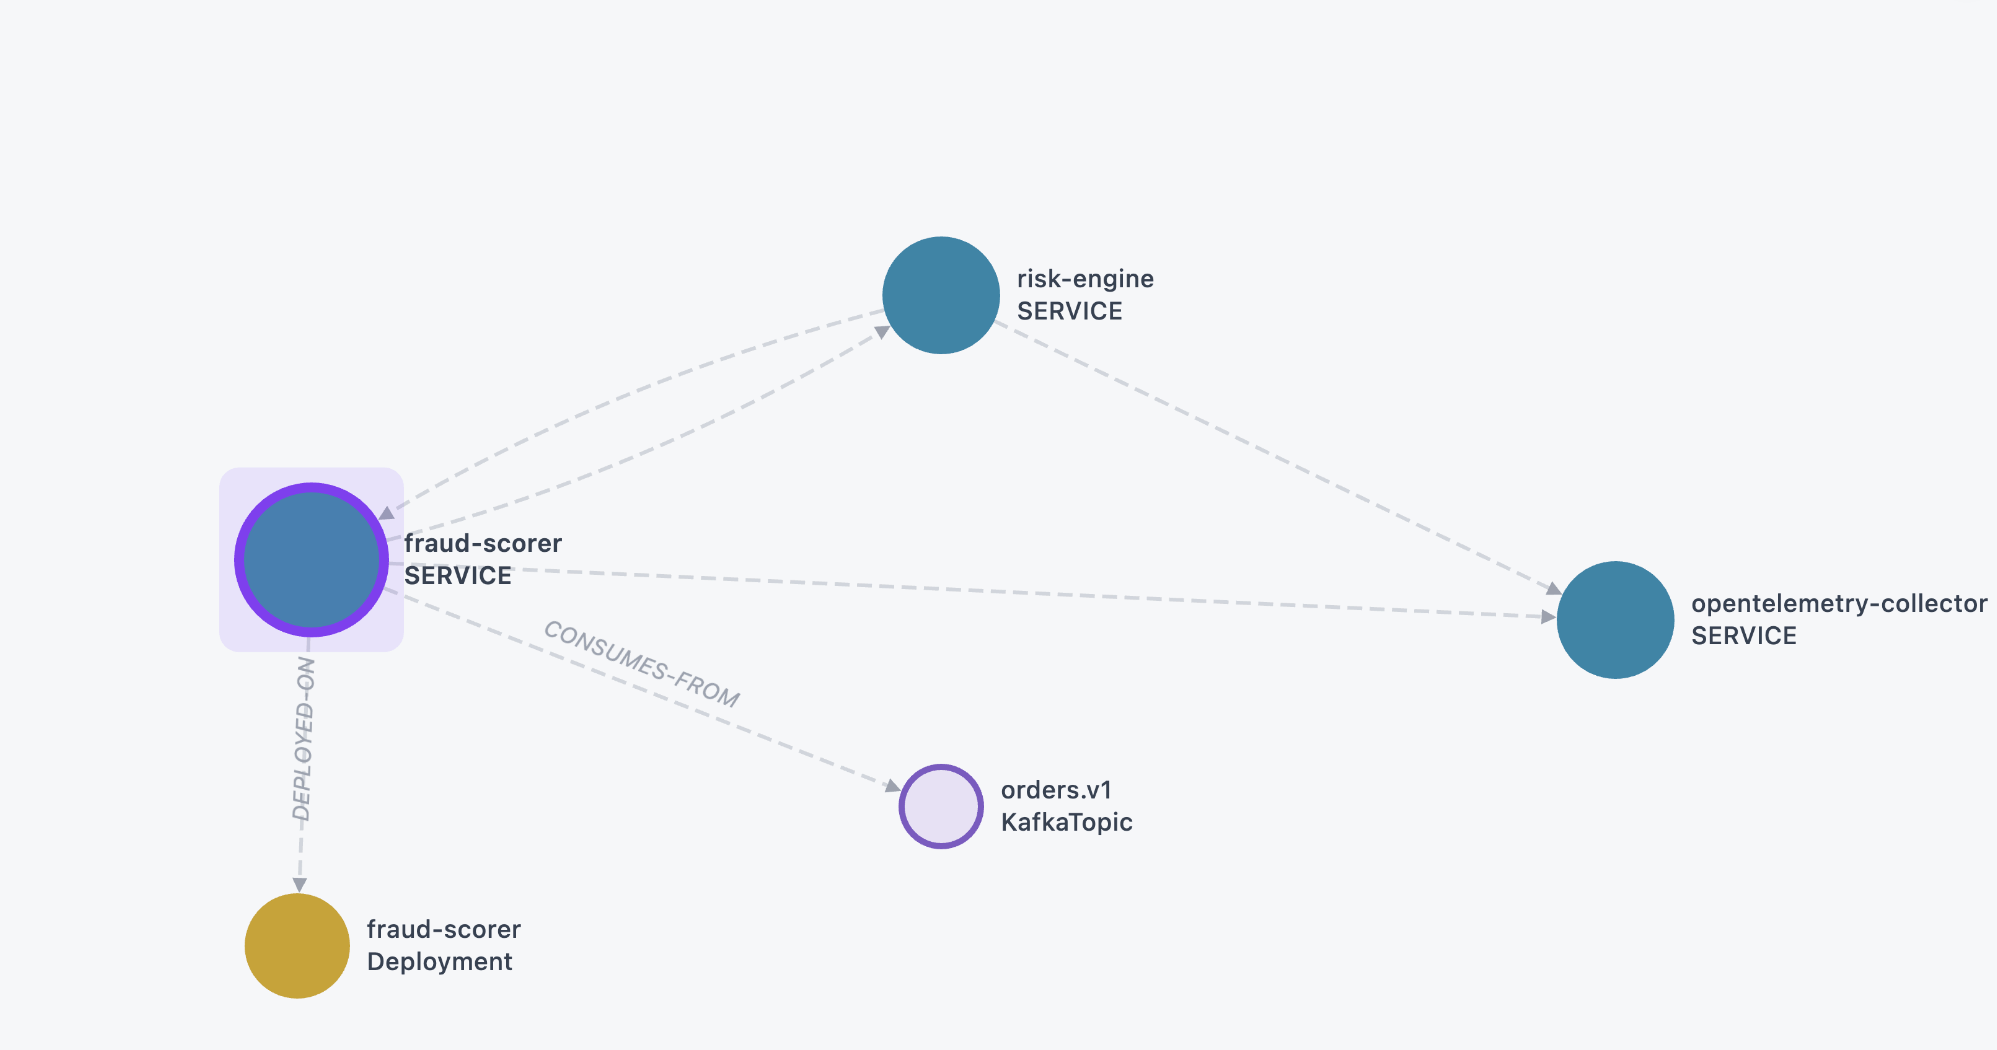
The other half is the change timeline. risk-engine picked up a deploy shortly before the stall began. That deploy sits on risk-engine's own history, the same place any service's deploys, restarts, and crash loops already live. Line the two up, the deploy and the onset of the lag climb, and the walk is complete: topic, to consuming service, to the HTTP call it makes, to the change on the other end of that call.
None of this comes from a snapshot taken earlier. The lag, the offsets, the cluster's health: all of it is read live, from the customer's own metrics, at the moment an investigation runs. A dependency map that's an hour old tells you what things looked like then, not what's happening now, and a stall doesn't wait for the next scrape to matter.
Why this didn't need a new Kafka brain
It's tempting to read this as "NOFire's Kafka support got smarter." That's not the delta. The dependency graph, blast radius, and change-event history all predate this work; they're what NOFire already does for every service in the graph. What changed is that Kafka's topics and consuming services are now nodes in it. The walk to risk-engine isn't a new inference built for this one scenario. It's the same graph traversal NOFire already runs, reaching one hop further because Kafka finally joined it.
That's also the honest boundary. What's deterministic and Kafka-native today, a poison record named by topic, partition, and offset, a schema change caught the moment a producer widens a field the registry approves under backward compatibility, a rebalance or a bad deploy on the consumer itself, comes from a closed cause vocabulary scored over co-timed evidence. The walk to a downstream dependency like risk-engine is a graph traversal, not a scored cause in that vocabulary yet.
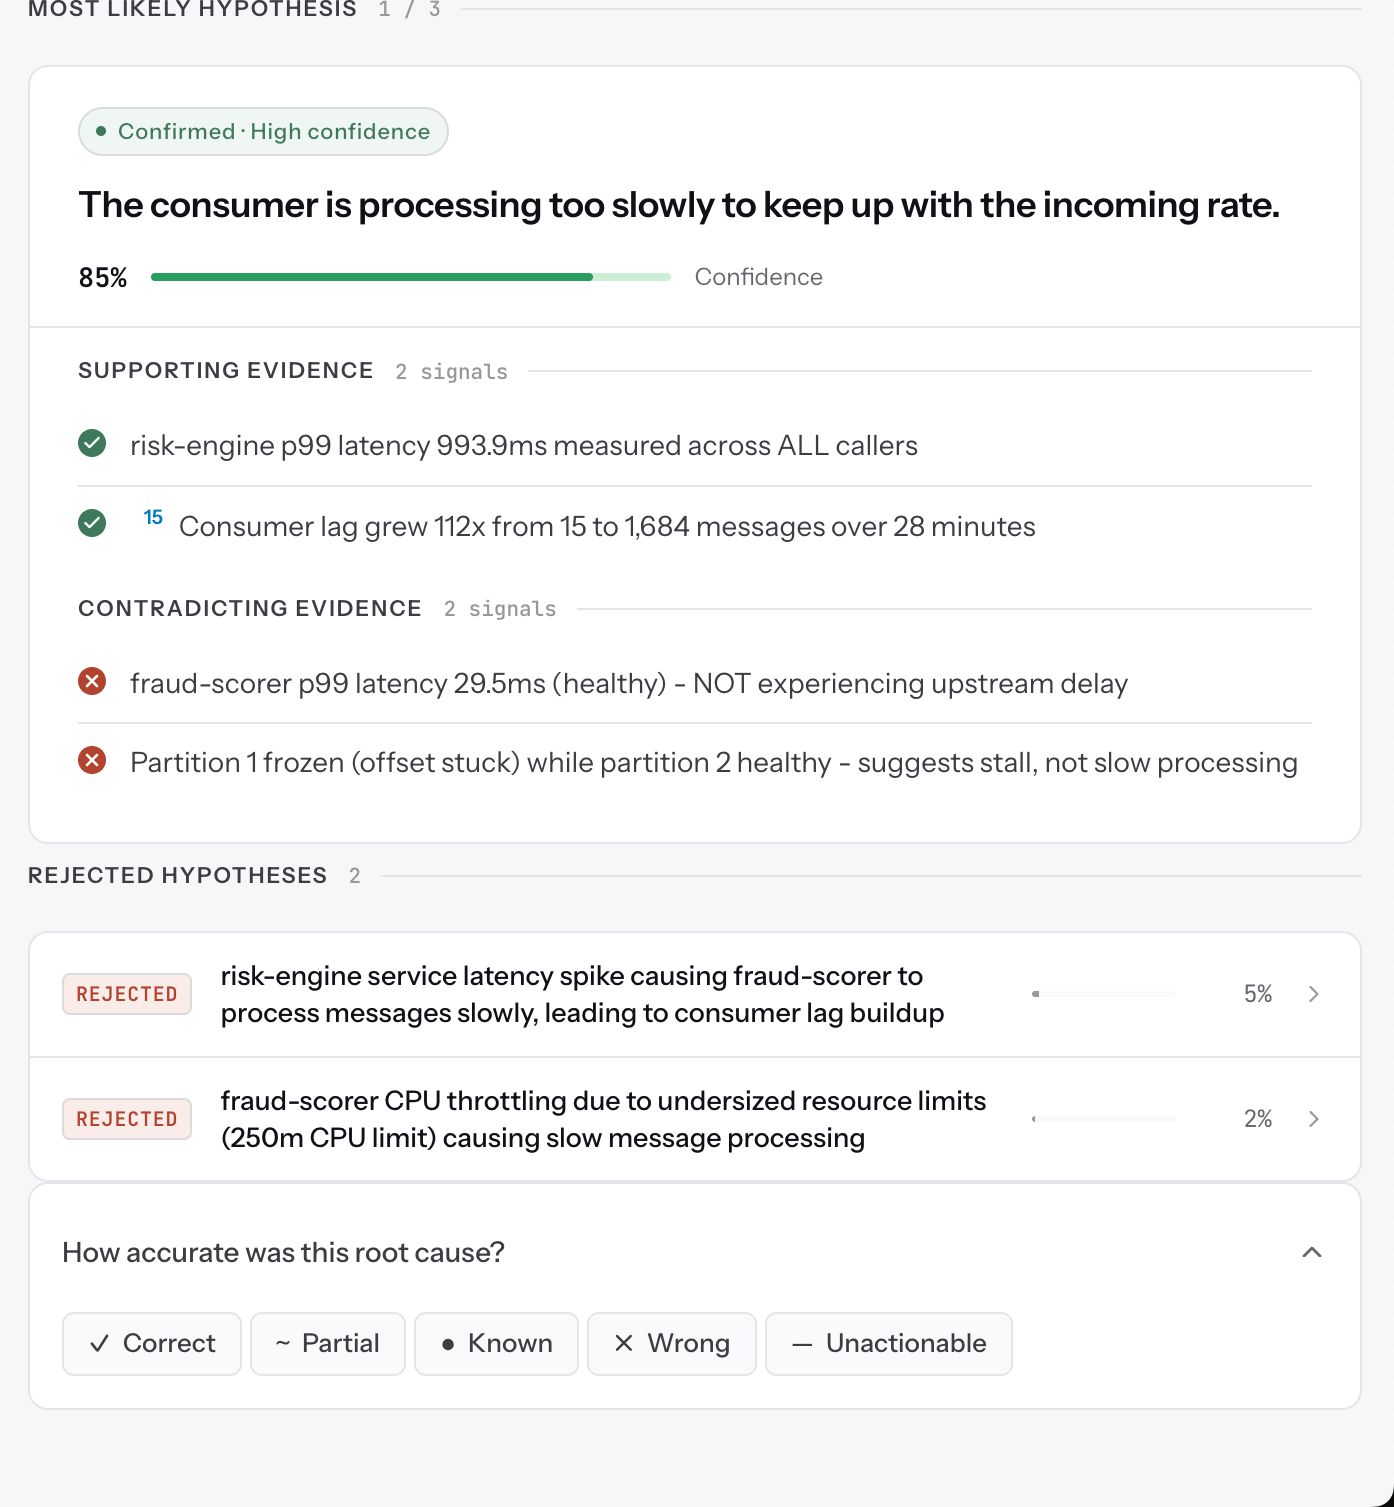
Ask NOFire why a stall happened today and you'll get a ranked cause for what's Kafka-native: a poison record, a schema change, a bad deploy, a rebalance. For a downstream HTTP dependency like risk-engine, that specific ranking isn't there yet. The walk is real, but today it's read off the topology graph and the change timeline side by side, not handed back as the answer to a question. That's still faster than assembling the same picture by hand across three dashboards and two teams, which is what a Kafka page costs most on-call engineers before they've formed a hypothesis.
Here's what that looks like, plainly, on this same cast of services: a real investigation, from a separate run on this order pipeline, its top hypothesis landing on something other than risk-engine, risk-engine's latency showing up as a signal but not the named cause.
The takeaway
A lag chart tells you a consumer is behind. It has no opinion on why. The outcome that matters isn't seeing the topic, it's seeing everything connected to it: end to end, from the application to the topic and back. NOFire's graph already had that visibility for every other service. Kafka joining it is what lets a Kafka symptom reach the same answer.
Kafka support is available today.