

5 months ago, we were not happy with how often our root cause investigation got the answer right. We wanted it higher, and we did not trust ourselves to get there by feel. So we built the work on evals and benchmarks first, and changed the agent only where they told us to.
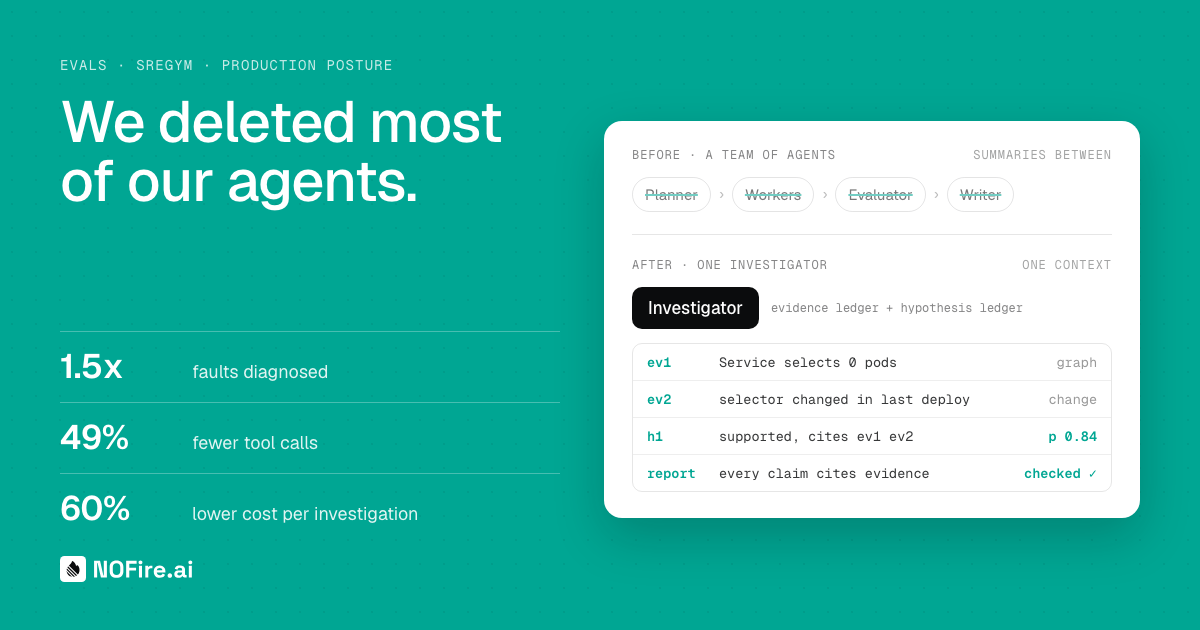
At the time, the investigation ran as a team of agents. A planner read the alert and proposed hypotheses. Workers took one hypothesis each and tested it with tools, each in its own context. An evaluator weighed what came back. A writer turned it into the report an engineer reads.
It looked like a good incident team. On our benchmark it was also the slowest, most expensive and least accurate design we have measured.
We replaced the team with one agent. Without Kubernetes tools, that one agent diagnosed 1.5x as many faults. It made 49% fewer tool calls, cost 60% less per investigation, and reached a diagnosis 2.5x faster.
None of this came from intuition. Every change went through the same evals, including the many we threw away. This post is what the eval told us, and the places where it told us no.
How we measure
SREGym is an independent benchmark from Tianyin Xu's lab at UIUC. It deploys real applications on Kubernetes, injects a real fault, and asks the agent what is wrong. SREGym's own LLM judge decides whether the agent diagnosed the fault. We did not write that judge. In every run in this post the judge was Claude Sonnet 5, never the model under test, and our harness refuses to start a run where the two match.
SREGym is one of several evals we run, and the one this post is about. We keep our own trace of every investigation and measure every step of it: each model call, each tool call, the tokens and the time. Because the trace records the evidence the agent saw, we can replay an investigation. We serve the same evidence to a changed agent and see how the change fares, without a live cluster or a new fault. We also rehearse single recorded requests many times over to measure how stable the answer is, and we measure causal accuracy on RCAEval. SREGym is the end-to-end test: a real fault in a real application, and a grade for the whole investigation.
The rules we held for every comparison in this post:
- 2 problem sets. We tuned on 21 problems. The final comparison ran on 105, and 84 of them were never used during tuning.
- 3 attempts per problem. Every attempt is scored. No best-of-N.
- Paired by problem. We compare both designs on the same problem, so an easy problem does not flatter either side. Our 95% intervals resample whole problems, with their 3 attempts together.
- The same model on both sides. Claude Sonnet 4.6 for both designs. We changed the architecture, not the model.
- Two postures. In production posture the agent gets metrics, logs, traces and the change history NOFire already records, and no direct access to the Kubernetes API. Kubernetes still reaches it through the Production Context Graph: our in-cluster agent watches objects with read-only access and records their specs, selectors, ports, limits and changes, with environment values hashed. Our customers run the same setup. In the second posture the agent also gets read-only Kubernetes tools. In each posture, both designs ran side by side on the same machines.
- What we count. Cost is what the agent spends on the model, at list prices. It leaves out Jev, the benchmark's judge, compute, and keeping the graph current. Time runs from the moment the agent receives the problem to its report, so it includes the work done before the first turn. Failed investigations count in both.
"Diagnosed" here means SREGym's judge said so. That is a different bar from the one in our earlier SREGym post, on a different problem set, so the two results do not compare.
What one agent changed
The larger problem set, 3 attempts per problem, the one investigator compared with the team:
| Investigator vs the team | No Kubernetes tools | With Kubernetes tools |
|---|---|---|
| Faults diagnosed | 1.5x | 1.3x |
| Tool calls per investigation | −49% | −63% |
| Model calls per investigation | −47% | −65% |
On faults diagnosed, the 95% interval runs from 1.3x to 1.7x without Kubernetes tools, and from 1.2x to 1.4x with them. On SREGym's diagnosis score, which runs from 0 to 1, the paired gain was +0.15 (0.11 to 0.19) without Kubernetes tools and +0.10 (0.07 to 0.13) with them.
In production posture, paired by problem, the investigator did better on 3.9x as many problems as it did worse on. For every problem that went from passing to failing every attempt, 6.5 went the other way.
The result I did not expect: the gap was wider without the Kubernetes tools. When we took the Kubernetes tools away, the team's score dropped 1.7x as much as the investigator's. Production posture is how our customers run, so that is the number that matters.
Cost and latency
Accuracy is what we set out to improve. The savings came with it, in both postures:
| Investigator vs the team | No Kubernetes tools | With Kubernetes tools |
|---|---|---|
| Cost per investigation, mean | −60% | −70% |
| Time to a diagnosis, median | 2.5x faster | 3.6x faster |
| Time to a diagnosis, slowest 10% | 2.2x faster | 2.5x faster |
The saving comes from two places. Each agent in the team started its own context, and a new context is written to the prompt cache at full price. The investigator writes its context once and reads earlier turns back from the cache, at 10% of the price. The team also spent its most expensive tokens, output tokens, on messages between agents.
The slowest investigations matter most during an incident, and they improved about as much as the typical one.
Why one agent wins
The comparison measures a whole system. The investigator is not only the team minus 4 agents: it also brings the evidence ledger, the namespace scan and the report checks described below. Both designs had the same model, the same tools and the same graph. The difference in evidence is that the team's writer saw only the workers' summaries, never their raw tool results. A team that shares one evidence store is a comparison we have not run yet. This is what we think explains the gap.
Every handoff in the team was a summary. The planner's evidence reached a worker as a sentence. A worker's findings reached the writer as a paragraph. Each handoff dropped detail, and the writer had no way to go back for it. On the tuning set, the team generated 5x as much text as the investigator. Most of that text was agents writing to each other.
The investigator keeps everything in one context and records two ledgers as it works:
- Evidence. Every tool result gets an id the moment it arrives.
- Hypotheses. Each one is open, supported or refuted, and cites the evidence behind it.
It finishes by calling a final_report tool, and code checks the report before anyone sees it. Every claim must cite evidence the run actually recorded. That shows where a claim came from, not that the evidence supports it; the judge described below asks that second question. An empty or failed tool result supports nothing. A steady error rate cannot prove that something changed. A failed check goes back to the agent as a reason, and the investigation continues.
Before the first turn, code reads the affected namespace from our Production Context Graph and flags objects that look wrong, such as a Service that selects no pods. That replaced several turns of probing service by service. On the tuning set, it cut cost per investigation by 23%.
We started from Anthropic's single-agent-loop-kit, which describes this pattern and how to measure a move to it. Credit where it is due: the kit's advice to change one thing at a time and pair every comparison is most of why these results hold up.
The model is not the system
One agent is half of the story. The other half is what the agent reads.
The investigator's tools answer from our Production Context Graph: a record of services, deployments, dependencies and changes that NOFire keeps current before any incident starts. Under it sits the Semantic Layer we have been building. It gives every entity one meaning, wherever it shows up: what it is, where it runs, which environment it belongs to, across clusters, clouds and vendors. When the agent asks about a service, it gets that service, its recent changes and its neighbours in one call, instead of searching for them. Most of the accuracy and the speed in this post come from there. We will write about both in a later post.
We tested that claim by changing the model. We ran the latest version of the investigator on the larger problem set, with read-only Kubernetes tools, on Claude Sonnet 5.5 and then on Claude Haiku 5.5, a much smaller model. SREGym's judge stayed Claude Sonnet 5 for both:
| Haiku 5.5 vs Sonnet 5.5 | Change |
|---|---|
| Faults diagnosed | < 5 percentage points lower |
| Score from 0 to 1, paired by problem | −0.02 (−0.05 to +0.01) |
| Cost per investigation, at list prices | 8x lower |
| Tool calls per investigation, median | 2x more |
| Time to a diagnosis, median | 2x slower |
Haiku is slower because it spends more tokens thinking before each step, and it makes 2x as many tool calls to reach a diagnosis. The interval on the paired score rules out a drop larger than 0.05. The 8x uses Haiku's list prices, with cache reads and writes priced at the same ratios as Sonnet's.
If the model did most of the work, a much smaller model would have lost much more. It did not. What carries the result is the architecture, the evidence the agent retrieves and the checks around its report.
The judge that doubled our bill
Next we added a judge: Jev, a System One model from TypeSafe. Jev does not write text. It returns typed answers with probabilities, fast enough to call on every turn. It answers narrow questions about the investigation. Does the evidence show this step? Does the cause explain the symptom? Is the cause established?
The first version did not change accuracy, and it raised the cost per investigation by 93%. Jev itself cost < 0.25% of what the agent cost, at about 0.1s per call. So where did the money go?
The answer was the prompt cache. We had put the judge's running scores in the system prompt. The scores changed after every turn, so the system prompt changed after every turn, and every change threw away the cached prefix. Distinct system prompts per investigation rose 2.3x. Cache writes rose 3x.
The fix was to move the scores to the end of the conversation, into the latest tool result. Cost went back to the level with no judge. Accuracy did not move.
The rule we took from it: what changes goes at the end of the prompt. Without a cost column next to the accuracy column, we would have shipped that bug and blamed the judge for being expensive.
The check that refused everything
The first judge also refused a report when it could not see a step of the causal chain directly in the evidence. It refused at least once in nearly 9/10 investigations, at the same rate for right reports and wrong ones.
A check that fires as often on right diagnoses as on wrong ones does not tell them apart, and it costs turns. We removed it. We have not measured whether it caught weak reasoning inside right answers. Refusals fell 14x, and the diagnosis rate did not move.
With the refusals gone, the judge's confidence became useful. The model rated itself near certain whether it was right or wrong. The judge's confidence tracked reality: in its lowest band ~25% of reports were right, and in its top bands > 90% were.
So we gave the judge a second job: end the investigation once a hypothesis is established. We set its threshold on the small set and froze it before the larger run. On the larger set, with Kubernetes tools, it ended about 1 in 4 investigations. 2 of those 77 diagnoses were wrong: < 3%, with a 95% upper bound of 9%.
What we did not ship
The eval said no more often than yes. Some of what it rejected:
- A prompt that read better. It scored higher on average, inside the noise, and it lost 70% of its score on 1 problem that had been working.
- 2 investigators and a judge to pick between them. 2x the cost, for a gain inside the noise. Sometimes the judge picked the worse report.
- Stacking every improvement. Each one helped on different problems. Combined, the average did not rise. What the combination did was lift the floor: it had the fewest complete failures of any version. We kept it for that reason, and then tested it on problems it had never seen.
Tuned on the small set, tested on the large one
Every improvement in this post was tuned on the small problem set. That is the classic setup for fooling yourself.
So the final comparison ran on the larger set, both designs side by side. The gain held, in both postures, and it was largest in production posture. It also held on the 84 problems we never used in tuning, taken alone: 1.5x as many faults diagnosed without Kubernetes tools (1.3x to 1.8x), and 1.25x with them (1.1x to 1.4x).
After this run, the larger set stopped being held out. We used it to develop the versions that followed, including the one in the Haiku test. That test compares 2 models on the same code and the same problems, so it does not depend on the problems being unseen.
Giving back to SREGym
SREGym is open source, so when our runs hit a problem in the harness, we fix it upstream. Some of the fixes already merged:
- Deploy the finalizer cleanup controller before planting the finalizer
- Bound the namespace and stability waits by wall-clock time
- Give a timed-out agent the same cleanup grace as a normal exit
- Stop MCP tool handlers from blocking the event loop
More are in review, and we will keep upstreaming as we go.
Public benchmarks have a shelf life. Once the problems and their solutions are on the internet, the next generation of models can be trained on them, and a high score starts to measure memory instead of diagnosis. We think the field needs a consortium that maintains a private benchmark, with problems kept out of every training set. That is a post for another time. As CTO, I have been in discussions with other leaders in this space to move it forward.
Beyond Kubernetes
We focused on Kubernetes first because the large majority of our customers run on it, and so does our own infrastructure. Not everyone does. We have customers and design partners who run without Kubernetes, on managed databases, queues, serverless functions and cloud networking. We are building the next part of our eval suite for them, with the same rules: a tuning set, a held-out set, paired comparisons and every attempt counted.
To score answers across all of those, we need a shared vocabulary for how production fails. We have been building one: the Common Failure Enumeration (CFE). It does for production failures what CWE does for software weaknesses. Each class of failure gets a stable id, a definition, and a note on what it is not.
CFE is already in our evals. Jev places each root cause the investigator reports into a CFE class, and we compare that class with the one behind the injected fault. On the tuning set, the investigator named the right class of trigger 1.35x as often as the team did. This score ranks every version we built in the same order as SREGym's judge does. That gives us a second measure, independent of SREGym's judge.
We plan to publish CFE together with other teams who run production systems at scale, some of them at companies we compete with. A failure taxonomy only helps if everyone uses the same one.
What five months of evals bought us
The evals now pay for themselves. We know within hours whether an idea helps, so we try more ideas and keep fewer of them. Every change runs against the same suites, with cost and latency next to accuracy. That lets us ship an improvement that one customer needs without regressing for the others. Over these 5 months, the cost of an investigation fell 60% to 70%, and a smaller model cuts it by another 8x.
Where this is now
The investigator is merged. We are dogfooding it on our own infrastructure, and rolling it out to customers gradually. At each step we review the accuracy gains against the evals, and we track results by class of failure. If one class regresses while the average improves, we change the investigator before the rollout goes further.
On the benchmark, 2 experiments come next. The first gives a team of agents the investigator's shared evidence store and report checks, to separate orchestration from evidence access. The second is a blind review by SREs that grades each report on 2 separate questions: is the diagnosis right, and does its evidence support it.
If you build agents
- Measure the architecture before the prompt. Our largest gain came from removing agents, not from rewording them.
- Put cost next to accuracy. Our most expensive bug was invisible to accuracy.
- Check that a guardrail separates right from wrong before you keep it. One that fires as often on both does not tell them apart.
- Hold out a test set. Run the final comparison there, once.
- Pair by problem, run several attempts, and count every attempt.
To see the investigator work on your own systems: get a demo.