Skip to content
NOFire.ai

One agent diagnosed 1.5x as many faults as a team.

We test every change to the NOFire AI investigator on SREGym, an independent Kubernetes benchmark, paired by problem.

One agent against a team of agents, 105 problems, 3 attempts each, same model, no Kubernetes tools

  • 1.5xfaults diagnosed, 95% interval 1.3x to 1.7x
  • 49%fewer tool calls per investigation
  • 60%lower cost per investigation, mean
  • 2.5xfaster to a diagnosis, median

One agent against a team of agents

Same model, same tools, same Production Context Graph. We replaced a planner, workers, an evaluator and a writer with one agent loop and a ledger of evidence. Both designs ran on the same 105 problems, 3 attempts each.

MeasureWith Kubernetes toolsNo Kubernetes tools, how customers run
Faults diagnosed1.3x (1.2x to 1.4x)1.5x (1.3x to 1.7x)
Diagnosis score from 0 to 1, paired by problem+0.10 (0.07 to 0.13)+0.15 (0.11 to 0.19)
Tool calls per investigation63% fewer49% fewer
Model calls per investigation65% fewer47% fewer
Cost per investigation, mean70% lower60% lower
Time to a diagnosis, median3.6x faster2.5x faster
Time to a diagnosis, slowest 10%2.5x faster2.2x faster
Faults diagnosed on the 84 problems never used in tuning1.25x (1.1x to 1.4x)1.5x (1.3x to 1.8x)

The model on both sides was Claude Sonnet 4.6. Ranges are 95% intervals that resample whole problems.

The system changed results more than the model did

Pass rate of the new version over the old, paired by problem, with 95% intervals. A dot right of 1.0x is a gain. A line that crosses 1.0x is not a measured change.

  • One agent instead of a team, no Kubernetes tools105 problems1.5x1.3x to 1.7x
  • One agent instead of a team, with Kubernetes tools105 problems1.3x1.2x to 1.4x
  • One agent instead of a team, problems never used in tuning, no Kubernetes tools84 problems1.5x1.3x to 1.8x
  • One agent instead of a team, problems never used in tuning, with Kubernetes tools84 problems1.25x1.1x to 1.4x
  • Newer model, same system21 problems1.10x, interval crosses 1.0x0.92x to 1.32x
  • Haiku 5.5 instead of Sonnet 5.5, same system, with Kubernetes tools102 problems0.93x0.87x to 0.99x
  • More reasoning effort, 3 settings21 problemsOn the score, no setting was significant after the Holm correction.
Show the chart as a table
ChangeProblemsPass rate, new over old95% intervalClear of 1.0x
One agent instead of a team, no Kubernetes tools105 problems1.5x1.3x to 1.7xYes
One agent instead of a team, with Kubernetes tools105 problems1.3x1.2x to 1.4xYes
One agent instead of a team, problems never used in tuning, no Kubernetes tools84 problems1.5x1.3x to 1.8xYes
One agent instead of a team, problems never used in tuning, with Kubernetes tools84 problems1.25x1.1x to 1.4xYes
Newer model, same system21 problems1.10x0.92x to 1.32xNo
Haiku 5.5 instead of Sonnet 5.5, same system, with Kubernetes tools102 problems0.93x0.87x to 0.99xYes
More reasoning effort, 3 settings21 problemsOn the score, no setting was significant after the Holm correction.

Why we deleted most of our agents

Every handoff between agents was a summary, and each summary dropped detail. One agent holds every tool result in one context, gives each result an id and ends with a report that code checks. Every claim in the report must cite evidence the run recorded.

Read the post
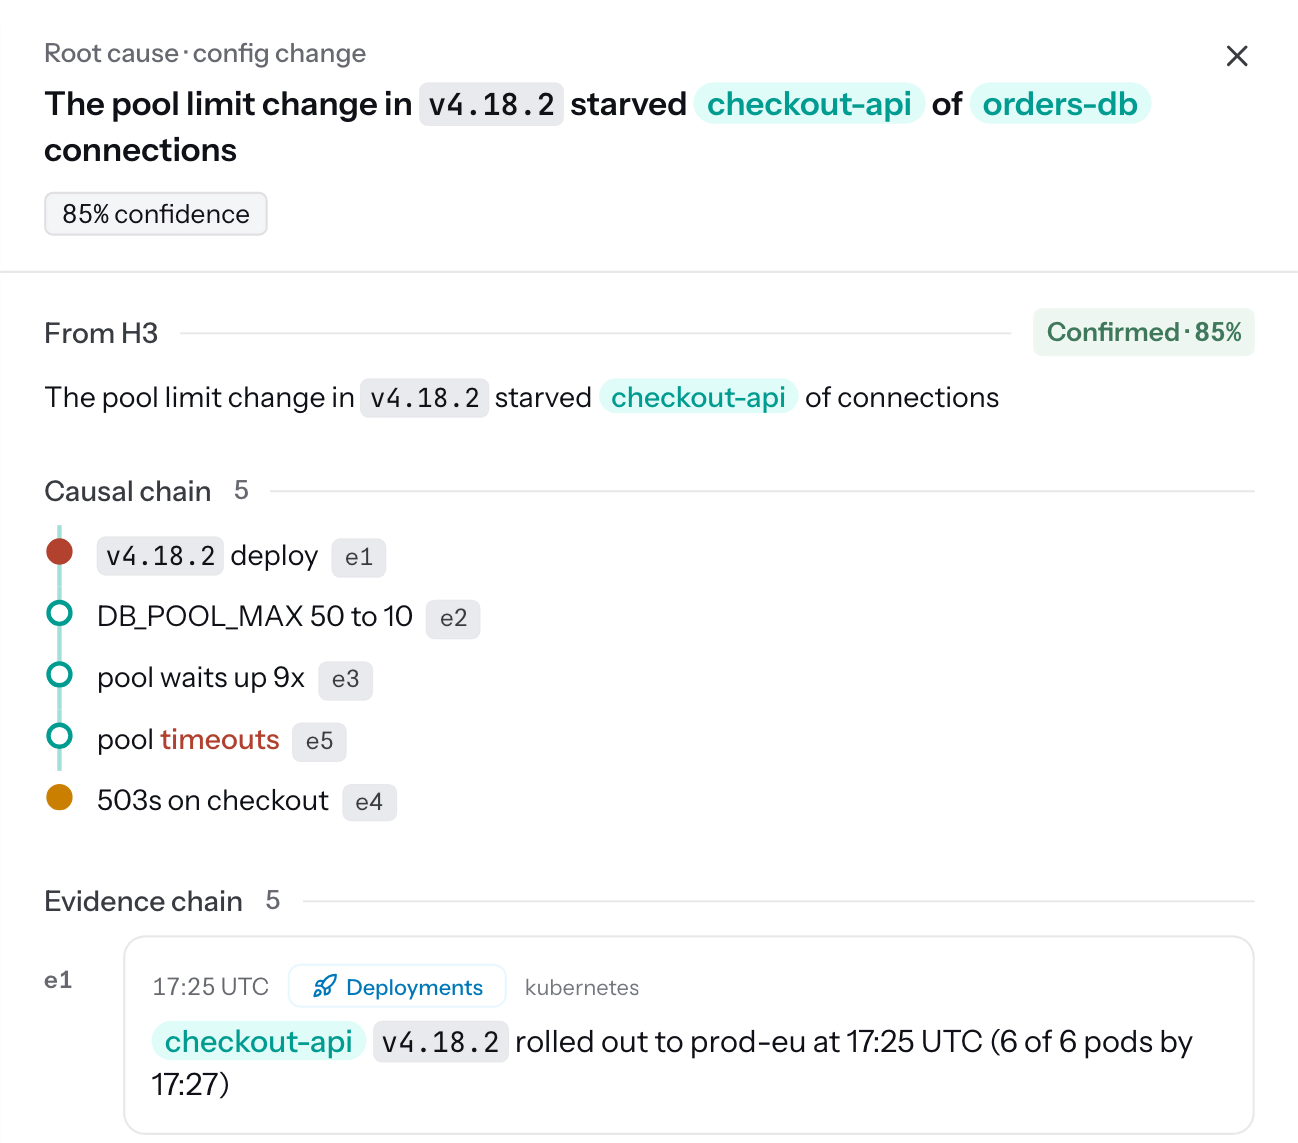
Demo data: a root cause report from a demo investigation, with the causal chain and the evidence behind each step

How we measure

SREGym gives a grade for the whole investigation. These are the rules we follow when we test a change.

SREGym, an independent benchmark

SREGym comes from Tianyin Xu's lab at UIUC. SREGym deploys an application on Kubernetes, injects a fault and asks the agent for the root cause. The SREGym judge scores each answer from 0 to 1, and an answer passes at 0.70. In the runs that compared one agent with a team, the judge was Claude Sonnet 5, never the model under test.

Count problems, not attempts

We tune on 21 problems and confirm on 105, and 84 of the 105 were never used in tuning. Each problem gets 3 attempts, every attempt is scored, and there is no best of 3. Attempts on one problem tend to agree, so 63 attempts are worth about 33 independent ones. Intervals resample whole problems.

Run the same build twice first

Before comparing two versions, we compare one build with the same build. Across eight pairs of runs of the same build, the pass rate moved by up to 20 points with nothing changed. Cohen's kappa between the two runs ran from 0.34 to 0.73. In the worst pair, an image pull failure in the second run looked exactly like a regression.

Nothing changed, and the pass rate moved by up to 20 points

  • Pair 1−19.7kappa 0.46
  • Pair 2−6.2kappa 0.34
  • Pair 3−2.5kappa 0.55
  • Pair 4−2.4kappa 0.48
  • Pair 5−1.6kappa 0.73
  • Pair 6−1.6kappa 0.42
  • Pair 7+9.0kappa 0.57
  • Pair 8+11.8kappa 0.39
Eight pairs of runs of the same build on the set of 21 problems. Each bar is the second run minus the first, in points, with Cohen's kappa between the two runs. The dark bar is the pair with the image pull failure.

Write the rules before the run

The test, the metric and the decision rule are fixed before the run. With 21 problems and 3 attempts, the smallest change a sign test detects 80% of the time is about 32 points. So a run of 21 problems can screen an idea but cannot accept one. Spending attempts on more problems beats more repeats.

Spend attempts on problems, not repeats

  • 21 problems x 332 points63 attempts
  • 21 problems x 628 points126 attempts
  • 42 problems x 322 points126 attempts
  • 63 problems x 318 points189 attempts
  • 105 problems x 116 points105 attempts
  • 105 problems x 312 points315 attempts
Smallest change in pass rate detected 80% of the time, in points. Lower is better. The two dark bars spend the same 126 attempts in two ways. Simulated from 48 of our runs with a one-sided paired sign test. Values move by about 2 points between simulations.

Cost and time next to accuracy

Cost is the model spend at list prices. Time runs from the problem to the report. Failed investigations count in both. A judge step once raised the cost by 93% with no change in accuracy, and only the cost column showed the bug.

Two postures

In production posture the agent reads metrics, logs, traces and the change history NOFire AI records, with no direct access to the Kubernetes API. Our customers run this way. In the second posture the agent also gets read-only Kubernetes tools.

A second judge

A judge from a different model family scored 376 attempts. Agreement with the SREGym judge was a kappa of 0.66. A result that changes with the judge is not yet a finding.

What these numbers do not show

  • SREGym runs on the benchmark's own applications and faults, not on your production.
  • Public problems can end up in model training data. A high score can then measure memory instead of diagnosis.
  • The comparison measures a whole system. The single agent also brought an evidence ledger, a namespace scan and report checks. A team with one shared evidence store is a test we have not run yet.
  • On the score, the newer model's gain was significant under the SREGym judge. Under a second judge the gain was half as large and no longer significant.
  • Attempts on one problem are not fully independent. Attempt 3 passed 0.87x as often as attempt 1. A harness bug is one explanation we are testing.
  • After the held-out run, the 105 problems stopped being held out. Later versions, including the one in the Haiku test, were developed on them.
  • SREGym does not measure time to resolution in your production.

Put AI agents to work on production, safely.